China Extends Gold Accumulation Into Price Weakness
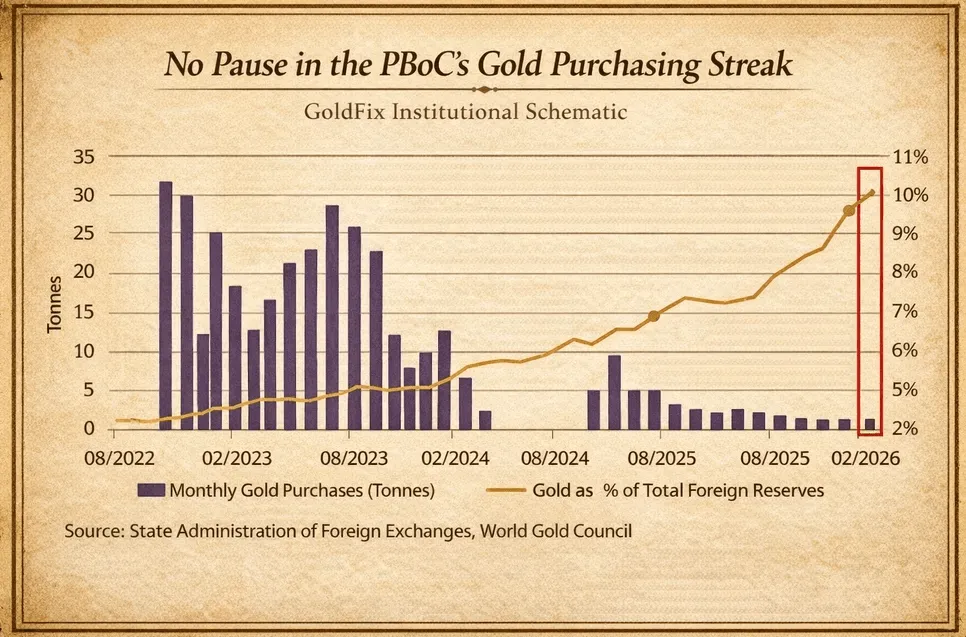
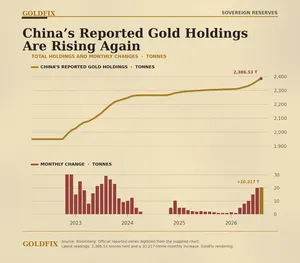
For the sixteenth consecutive month, the People’s Bank of China added to official gold reserves, increasing holdings by 30,000 ounces in February to approximately 2,309 metric tonnes (74.22 million ounces), valued near $388 billion. This places gold at roughly 9–10% of total foreign reserves publicly disclosed.
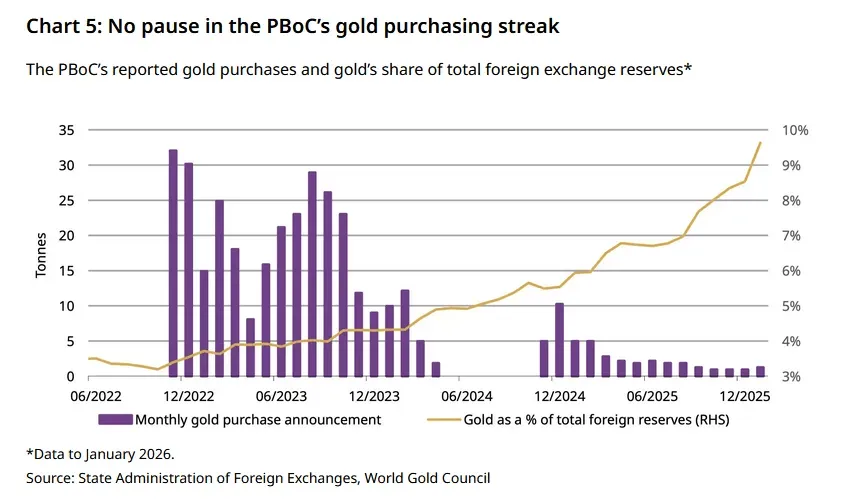
Bloomberg reporting frames this continuation as policy-driven accumulation occurring despite elevated prices and heightened geopolitical tension. The addition extends a steady program that began in November 2024, with cumulative purchases of roughly 1.4 million ounces over that period.
Official Sector Behavior: Price Insensitive, Policy Anchored
The timing is notable. The PBOC continues to accumulate even as gold trades below recent highs, following a ~16% correction from January peaks. This aligns with central bank behavior historically observed during reserve diversification cycles: accumulation is conducted independent of short-term price volatility.
China remains well below the largest sovereign holders (United States and Germany), yet the trajectory is directional. The current pace implies a gradual reweighting of reserves toward non-dollar assets rather than a rapid repositioning.
Bloomberg’s framing emphasizes geopolitical and monetary motivations, specifically reserve diversification and hedging against global instability. The consistency of monthly additions reinforces that interpretation.
Parallel Market Structure: Retail Accumulation vs Institutional Distribution
While official sector demand remains steady, private market flows show a different configuration.
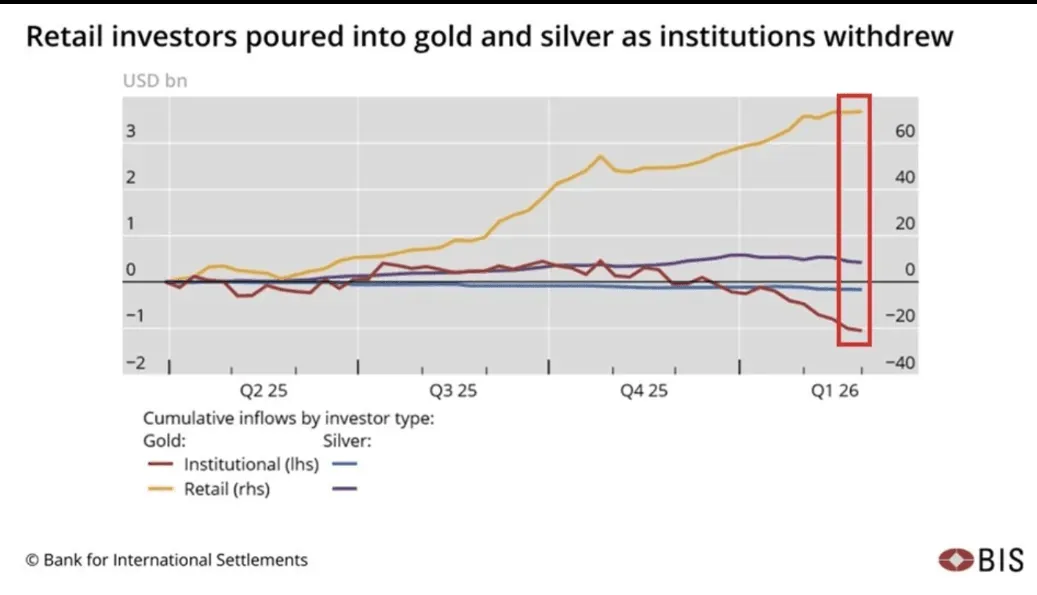
Data cited from the Bank for International Settlements highlights a surge in retail participation:
“Retail-driven exuberance… set the stage for outsize moves.”
Retail investors have allocated approximately $70 billion into gold ETFs since Q2 2025, with flows tripling over the last six months. This represents a meaningful shift in marginal demand, with retail capital increasingly driving price momentum.
At the same time, institutional positioning has moved in the opposite direction. Selling began in mid-November and accelerated into early 2026, coinciding with the market correction.
The result is a bifurcated structure:
- Official sector: steady accumulation
- Retail sector: aggressive inflows
- Institutional sector: distribution into strength
Volatility Transmission: Leverage and Mechanical Selling
The correction phase in early 2026 highlights how this structure translates into price action.
According to BIS analysis, the decline was amplified by mechanical factors rather than a fundamental shift in demand:
“Daily rebalancing of leveraged ETFs and margin-triggered liquidations amplified the swings.”
Leveraged ETF structures and CTA-style trend-following strategies contributed to forced selling during the downturn. Silver, in particular, experienced sharper dislocations due to concentrated speculative positioning among smaller traders.
This dynamic explains the observed volatility: a market supported by strong underlying demand but vulnerable to short-term dislocations through leverage and positioning.
Positioning the Signal
Three concurrent signals emerge from the data:
- Central bank accumulation remains intact
The PBOC continues to add gold regardless of price level or short-term volatility. This reflects strategic reserve policy rather than tactical allocation. - Retail flows are now a dominant marginal driver
ETF inflows have accelerated significantly, contributing to both upside momentum and downside instability. - Institutional flows are countercyclical
Distribution into strength and reduced exposure during correction phases indicate a different time horizon and risk framework.
Interpretation Within the Current Cycle
The coexistence of these flows suggests that gold is operating across multiple layers simultaneously:
- As a reserve asset for sovereign balance sheets
- As a momentum asset for retail participation
- As a risk-managed allocation for institutional portfolios
The PBOC’s continued purchases into both strength and weakness anchor the long-term bid. In contrast, retail-driven flows introduce volatility, while institutional activity moderates exposure around price extremes.
The February data does not represent a change in trend.